Or
Venn Diagrams for Small People
With the Holidays quickly approaching, we naturally think more about family and those we love. In Pre-K this means many conversations pertaining to family members suffuse the day. We take the opportunity each fall to direct this curiosity into a classifying challenge. The set up starts like this:
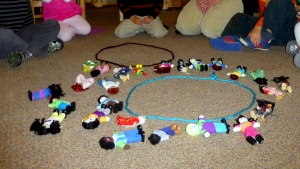
 We have two unidentified circles laying in the middle of the room, surrounded by dolls. The number of dolls is determined by the number of students in the class. We make sure that each child has an array to pick from to represent his or herself. After choosing a representative doll, the children must decide where their doll fits in our now labeled “brother” and “sister” circles.
Someone always discovers that we have two conundrums. Where do you put your doll if you don’t have any brothers or sisters? What do you do if you have both? Here we have a problem to be solved.
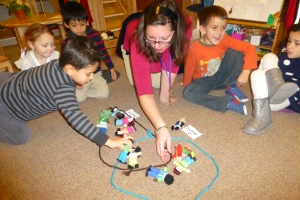
 This year, a few children suggested that we should make a third circle to represent those with both brothers and sisters. While we discussed the advantages and disadvantages to that solution, another child suggested we could just put them in both circles. Of course our response was, “How?”
 Following some childrens’ advice about yarn placement, we quickly adjusted the circles so that they overlapped. (Note: All I’m doing in this photograph is moving the string.) Once the overlap was established, it was easy to see how those with both brothers and sisters might be represented.


